What’s up with investment data in London, the UK and Europe?
London & Partners, the Mayor of London’s official promotional agency, issued a press release showing investment in the UK and London, as well as other European countries.
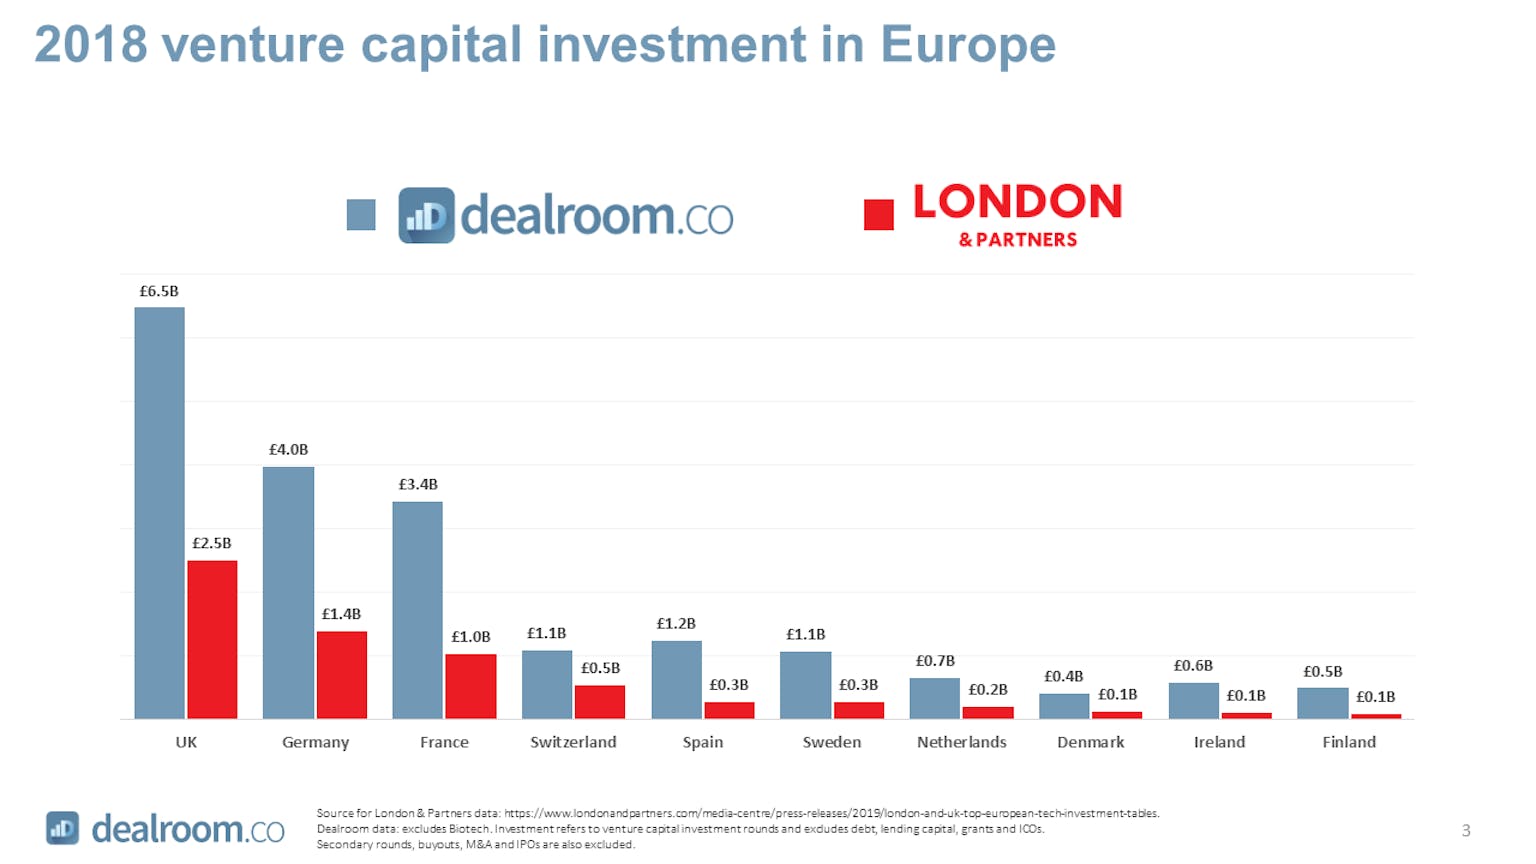
The London & Partners data used in the report, is sourced from Pitchbook. Pitchbook has since clarified to us that the data is incomplete. As a result it is roughly investment shown is 2.5x lower than Dealroom’s numbers. In the interest of clarity and transparency we prepared a side-by-side comparison, including a list of the top 50 rounds.
First, the UK and London data shows big differences in each year between 2013 and 2018.

In order to add credence to the Dealroom data, below are the 50 largest rounds in 2018 in the UK, which already add up to £2.8 billion, versus the £2.5 billion reported in the press release. Dealroom tracked roughly a thousand more rounds, adding up to £6.5 billion (excluding biotech).

Lastly, the numbers in Germany, France and other European countries show similar differences.

Explore and compare the United Kingdom funding rounds data in real time as an interactive chart or heatmap.
Notes on Dealroom.co methodology:
- Venture capital investment excludes debt, lending capital, grants, ICOs and other non-equity. Secondary rounds, buyouts, M&A and IPOs are also excluded
- We have excluded biotech. Including biotech the UK and European investment data would be even much higher
- Dealroom’s proprietary database and software aggregate data from multiple sources, including newsflow aggregation & processing, web scraping and manual research
- Data is verified and curated with an extensive manual process, augmented by data processing